Contact | 中文 | CAS  
   |  Home  |  Research  |  People  |  News  |  Labs  |  Fellowships&Cooperation  |  Education |
News
Events
Research News
Notice
Location:Home > News > Research News
Investigating Cold Dust Properties of 12 Nearby Dwarf Irregular Galaxies by Hierarchical Bayesian Spectral Energy Distribution Fitting
2021-08-17| 【A A A【Print】【Close】

Recently, the hierarchical Bayesian approach is introduced to fit the MBB model (Kelly et al. 2012; Juvela et al. 2013; Lamperti et al. 2019), which could reduce the degeneracy between T and β greatly, and so improve the SED fitting results. By applying a two-temperature modified blackbody (TMBB) model with a hierarchical Bayesian technique, we model the spectral energy distribution of 12 nearby dwarf irregular (dIrr) galaxies. We aim to probe potential submillimeter excess emission at 350, 500, and 850 μm and investigate the properties of cold dust parameters.

Based on the TMBB model with cold dust emissivity index (βc = 2), one galaxy shows 500 μm excess emission and nine galaxies show excess at 850 μm (five of them still show 850 μm excess in the case of free βc) (e.g., IC3268 in Figure 1). We find that the 850 μm excess emission is easily detected in the dIrr galaxies with low star formation activity. The 850 μm excess is more frequent and more prominent in dIrr galaxies with low molecular hydrogen gas mass fraction or low ratios between cold dust mass and gas mass. As galaxies evolve, the ratios between atomic hydrogen gas mass and stellar mass decrease and the 850 μm excess emission tends to decrease or even disappear. Our results suggest that the cold dust temperature may increase, as the dIrr galaxies have more intense star formation or richer metallicity. There is a weak anticorrelation between the cold dust-to-stellar mass ratio and the specific star formation rate for our galaxies. 

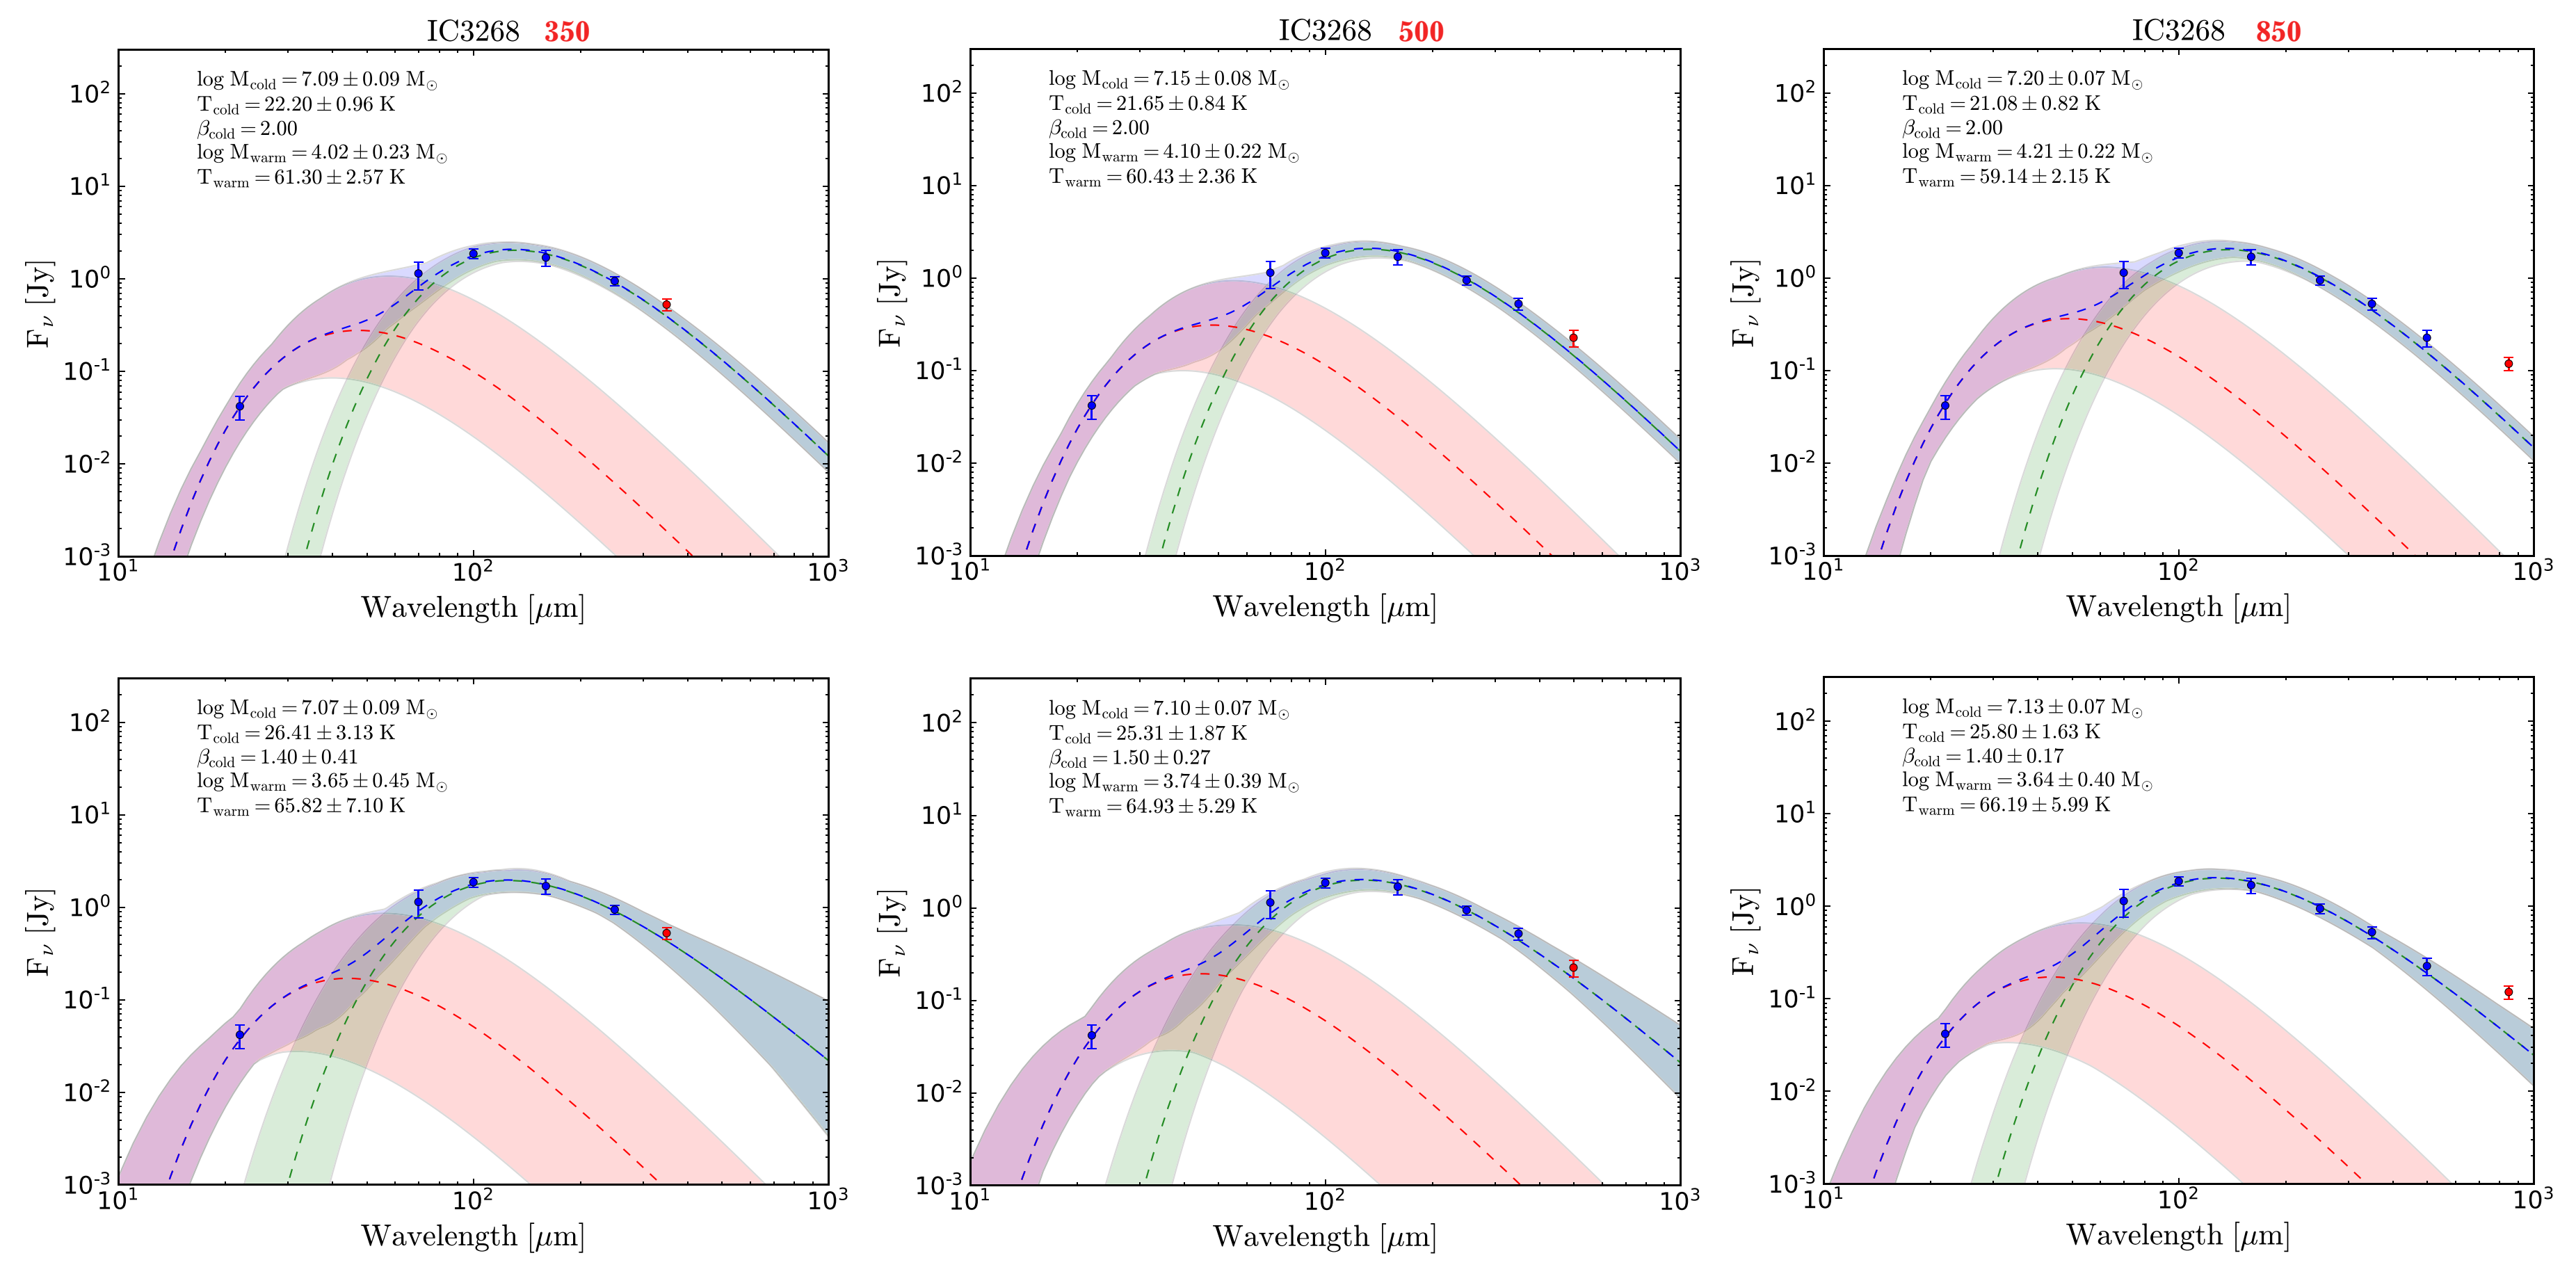
Figure 1. An example of global SEDs of IC 3268 obtained using the TMBB model (βw = 2 and βc = 2 or free) with the hierarchical Bayesian technique. The first line panels show the SED fits in the case of βc = 2 and the second line panels show the SED fits in the case of βc = free, from left to right, using the data ranging from 22–250 μm to predict 350 μm flux, from 22–350 μm to predict 500 μm flux and from 22–500 μm to predict 850 μm flux, respectively. The fitting result of the parameters is shown in the upper left corner of each panel. The warm component (with βw = 2) is overlaid in red and the cold component (with βc = 2 or free) is in green.

Article linkhttps://iopscience.iop.org/article/10.3847/1538-4357/abfe67

Contact: CHANG Zhengxue, ZHOU Jianjun

Xinjiang Astronomical Observatory, Chinese Academy of Sciences

Email: changzhengxue@xao.ac.cn zhoujj@xao.ac.cn 


Welcome to Xinjiang Astronomical Observatory © 2013
Address: 150 Science 1-Street, Urumqi, Xinjiang 830011, China
Tel: +86-991-3689373 Fax: +86-991-3838628